Background
I volunteered at NOVA ScriptsCentral (NSC), a nonprofit that provides healthcare and medication to underserved and uninsured communities in Northern Virginia. NSC had more than 15 years of records on the medication it had distributed — patient, medication type, and cost — and wanted a way to communicate that impact and see trends over time, both internally and on their website. I offered to use my technical skills to build it.
The problem
I hadn’t done much large-scale data engineering or visualization before, so I broke the work into steps. The data was the hard part: it was heterogeneous and inconsistently formatted, the recorded fields changed from year to year, and it was spread across multiple databases. Before any of it could be visualized, all of it had to be reconciled into one consistent structure.
Approach
I started by researching tools and chose Tableau, which was free and connected well to the database. Then I worked through the data year by year — normalizing each year into a common format and filling in or extrapolating missing values — and combined every year into a single dataset I could load into Tableau. From there I learned to build a dashboard that told a data story rather than just plotting numbers, and I iterated on it with continuous feedback from the NSC team.
Because I was building from a snapshot, I wanted the result to outlast me. I organized the combined dataset so the next volunteer could add future years easily, keeping the whole thing reusable rather than a one-off.
Result
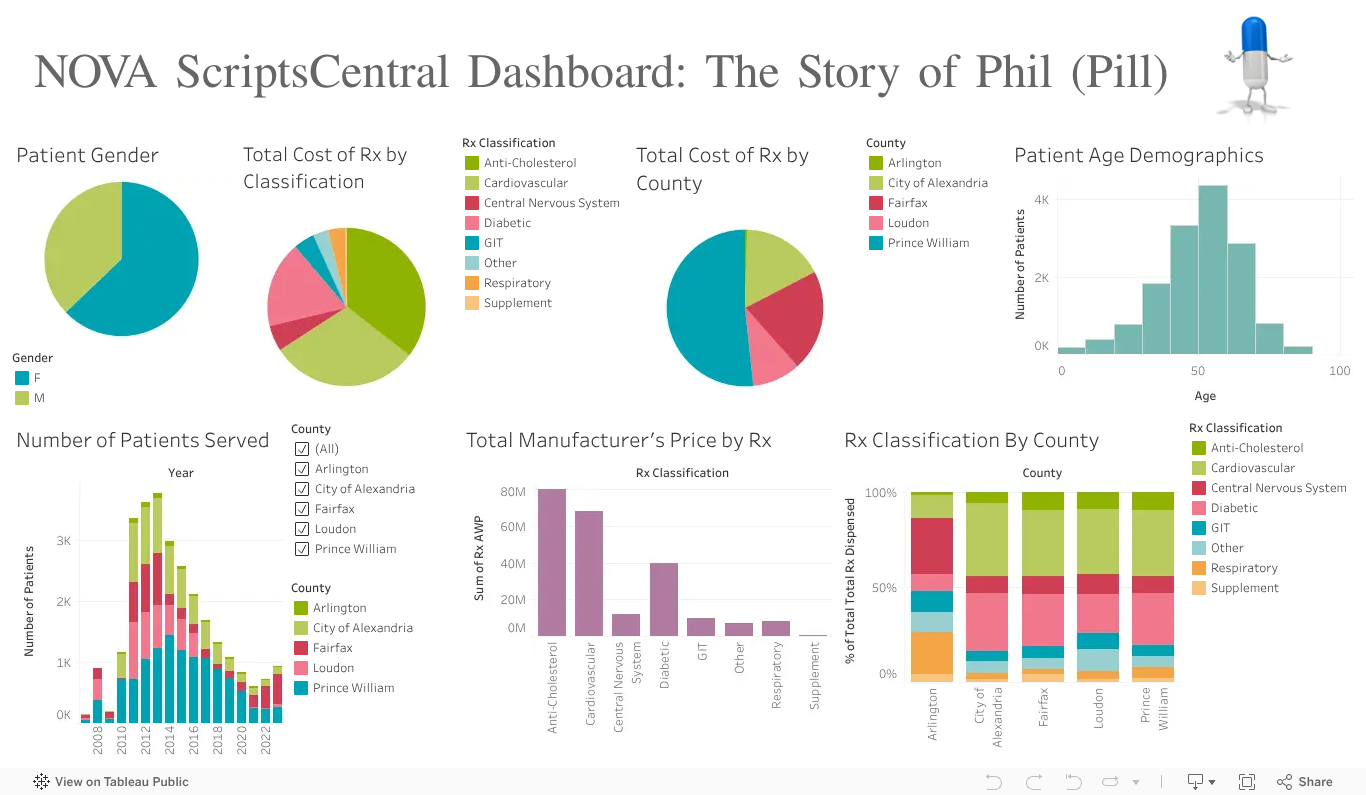
The final pipeline used 90–95% of NSC’s data and left behind a clean, organized database that is easy to extend. The dashboard below shows NSC’s geographic impact, the demographics of patients served, and the most common ailments, which helped the team decide where to focus medication distribution in the future. I also built PowerBI infographics for NSC’s partner clinics to track patients’ health journeys — including net new patients each month and vision-care appointment volume — so the clinics could better tailor their services.
Beyond the data
I also volunteered at NSC’s outreach events, where I took patient vitals, guided health activities, and presented on preventative care, including a talk on the importance of immunizations later in life. Working with Hispanic, Korean, and elderly patients — and speaking Spanish with some of them — showed me how much language and trust shape whether people can navigate the healthcare system.